For whom do you create a quality content? Of course, you are looking to attract the right audience. If your aim is to target the specific persona, you need to make sure that every piece of content you publish on your blog is what your audience really wants to read. And when it comes to planning your content strategy, ‘data’ has proven to be vital to better understand your customers.
Google Analytics- The main source of content data
Google Analytics is a robust, free-mium web analytics tool offered by Google that tracks and reports website traffic and the performance of your content.
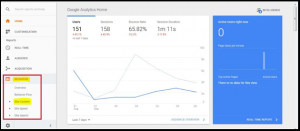
You can find the main source of content data within Google Analytics under ‘Behavior’ and ‘Site Content’ section. This section basically tells you exactly which content drives the most traffic, page-views and even conversions.

Following are the ways in which you can make a proper use of Google Analytics to come up with some great content ideas that can boost your content strategy.
Find the list of most popular contents
Each content written by you has a different effect on the audience. To check and analyze your performance, you can make use of the Google Analytics tool.
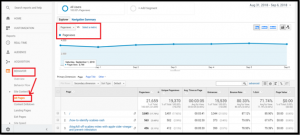
Find your popular and engaging content by going to ‘Site Content’, followed by ‘All Pages’. A list of each page and post on your site will be displayed that will mention how well each of the content performs. The list includes the following parameters:
| Metrics provided by Google Analytics | ||
| Sr. No. | Parameter | Definition |
| 1 | Pageviews | Pageviews is the total number of pages viewed. Repeated views of a single page are counted. |
| 2 | Unique Pageviews | Unique Pageviews is the number of sessions during which the specified page was viewed at least once. A unique pageview is counted for each page URL + page Title combination. |
| 3 | Avg. Time on Page | The average amount of time users spent viewing a specified page or screen or set of pages or screens. |
| 4 | Entrances | Entrances is the number of times visitors entered your site through a specified page or set of pages. |
| 5 | Bounce Rate | The percentage of single-page sessions in which there was no interaction with the page. A bounced session has duration of 0 seconds. |
| 6 | % Exit | %Exit is (number of exits) / (number of page views) for the page or set of pages. It indicates how often users exit from that page or set of pages when they view the page(s). |
| 7 | Page Value | The average value of this page or set of pages. Page Value is ((Transaction Revenue + Total Goal Value) divided by Unique Pageviews for the page or set of pages)). |
Sort the columns depending upon the goals you set for your website. For instance, if you prefer to judge the performance of your content based on pageviews, just sort the pageview column and you will see the content with the highest number of views on the top.
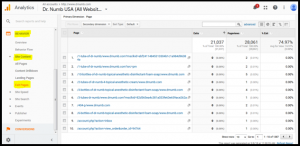
Take a thorough look at the report to understand which content received the most number of views. A glance at the entire report to find any similarity or common trend that you can capitalize on. For instance, in the below report you will observe that the most visited content are informative. Hence, you can target your content strategy revolving around ‘information.’

Look for the content that drives people off from your website
Apart from finding the most popular content, it is also important to know about the posts and content those are underperforming. The underperforming content will let you understand that what type of niche you should avoid while planning a content strategy.
To look into detail about the pages that visitors are exiting from, just go to Behavior’, ‘Site Content’, and then ‘Exit Pages’. Sort the ‘Exits’ column from ascending to descending to see which content is resulting in the most ‘leaks’.

Once you have extracted the above-mentioned data, follow the below-mentioned steps to minimize the damage:
• Insert a ‘call to action’ on your highest ‘Exit’ pages to direct visitors to other relevant content.
• Add a ‘Related Posts’ widget to these pages to entice visitors to stay on the site.
Increase your Brand Awareness using Google Analytics
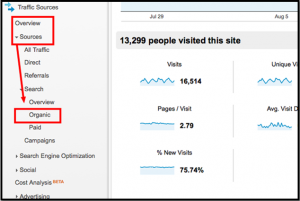
Use Google Analytics “Traffic Sources” and “Organic Search” option to fetch data and view the top referring search terms that attracted Web traffic to your site. It can be highly beneficial if you have a new product launch or new service and you wish to get your business in front of the potential new customers.

Use this fetched data to optimize the content- either a blog post announcing your new product, or a dedicated landing page—around these search terms. You can also attract more and more audience using Google’s Keyword Planner to identify related keywords, as well as highlight High Search/Low Competition keywords (this offers an opportunity to place highly for these search terms).
Make Google Analytics an important part of your content marketing strategy to brainstorm content ideas for your blog. Look at the reports to identify what kind of content works on your site and come up with similar content ideas to generate more traffic.

Started working as a digital marketing expert, Varun Sharma is now also a well-known digital marketing speaker – a speaker on performance development, and a trusted mentor to businesses in the digital world. His keynote expositions are based on the digital marketing theories, which provide a fascinating insight into the secrets of high performance.

