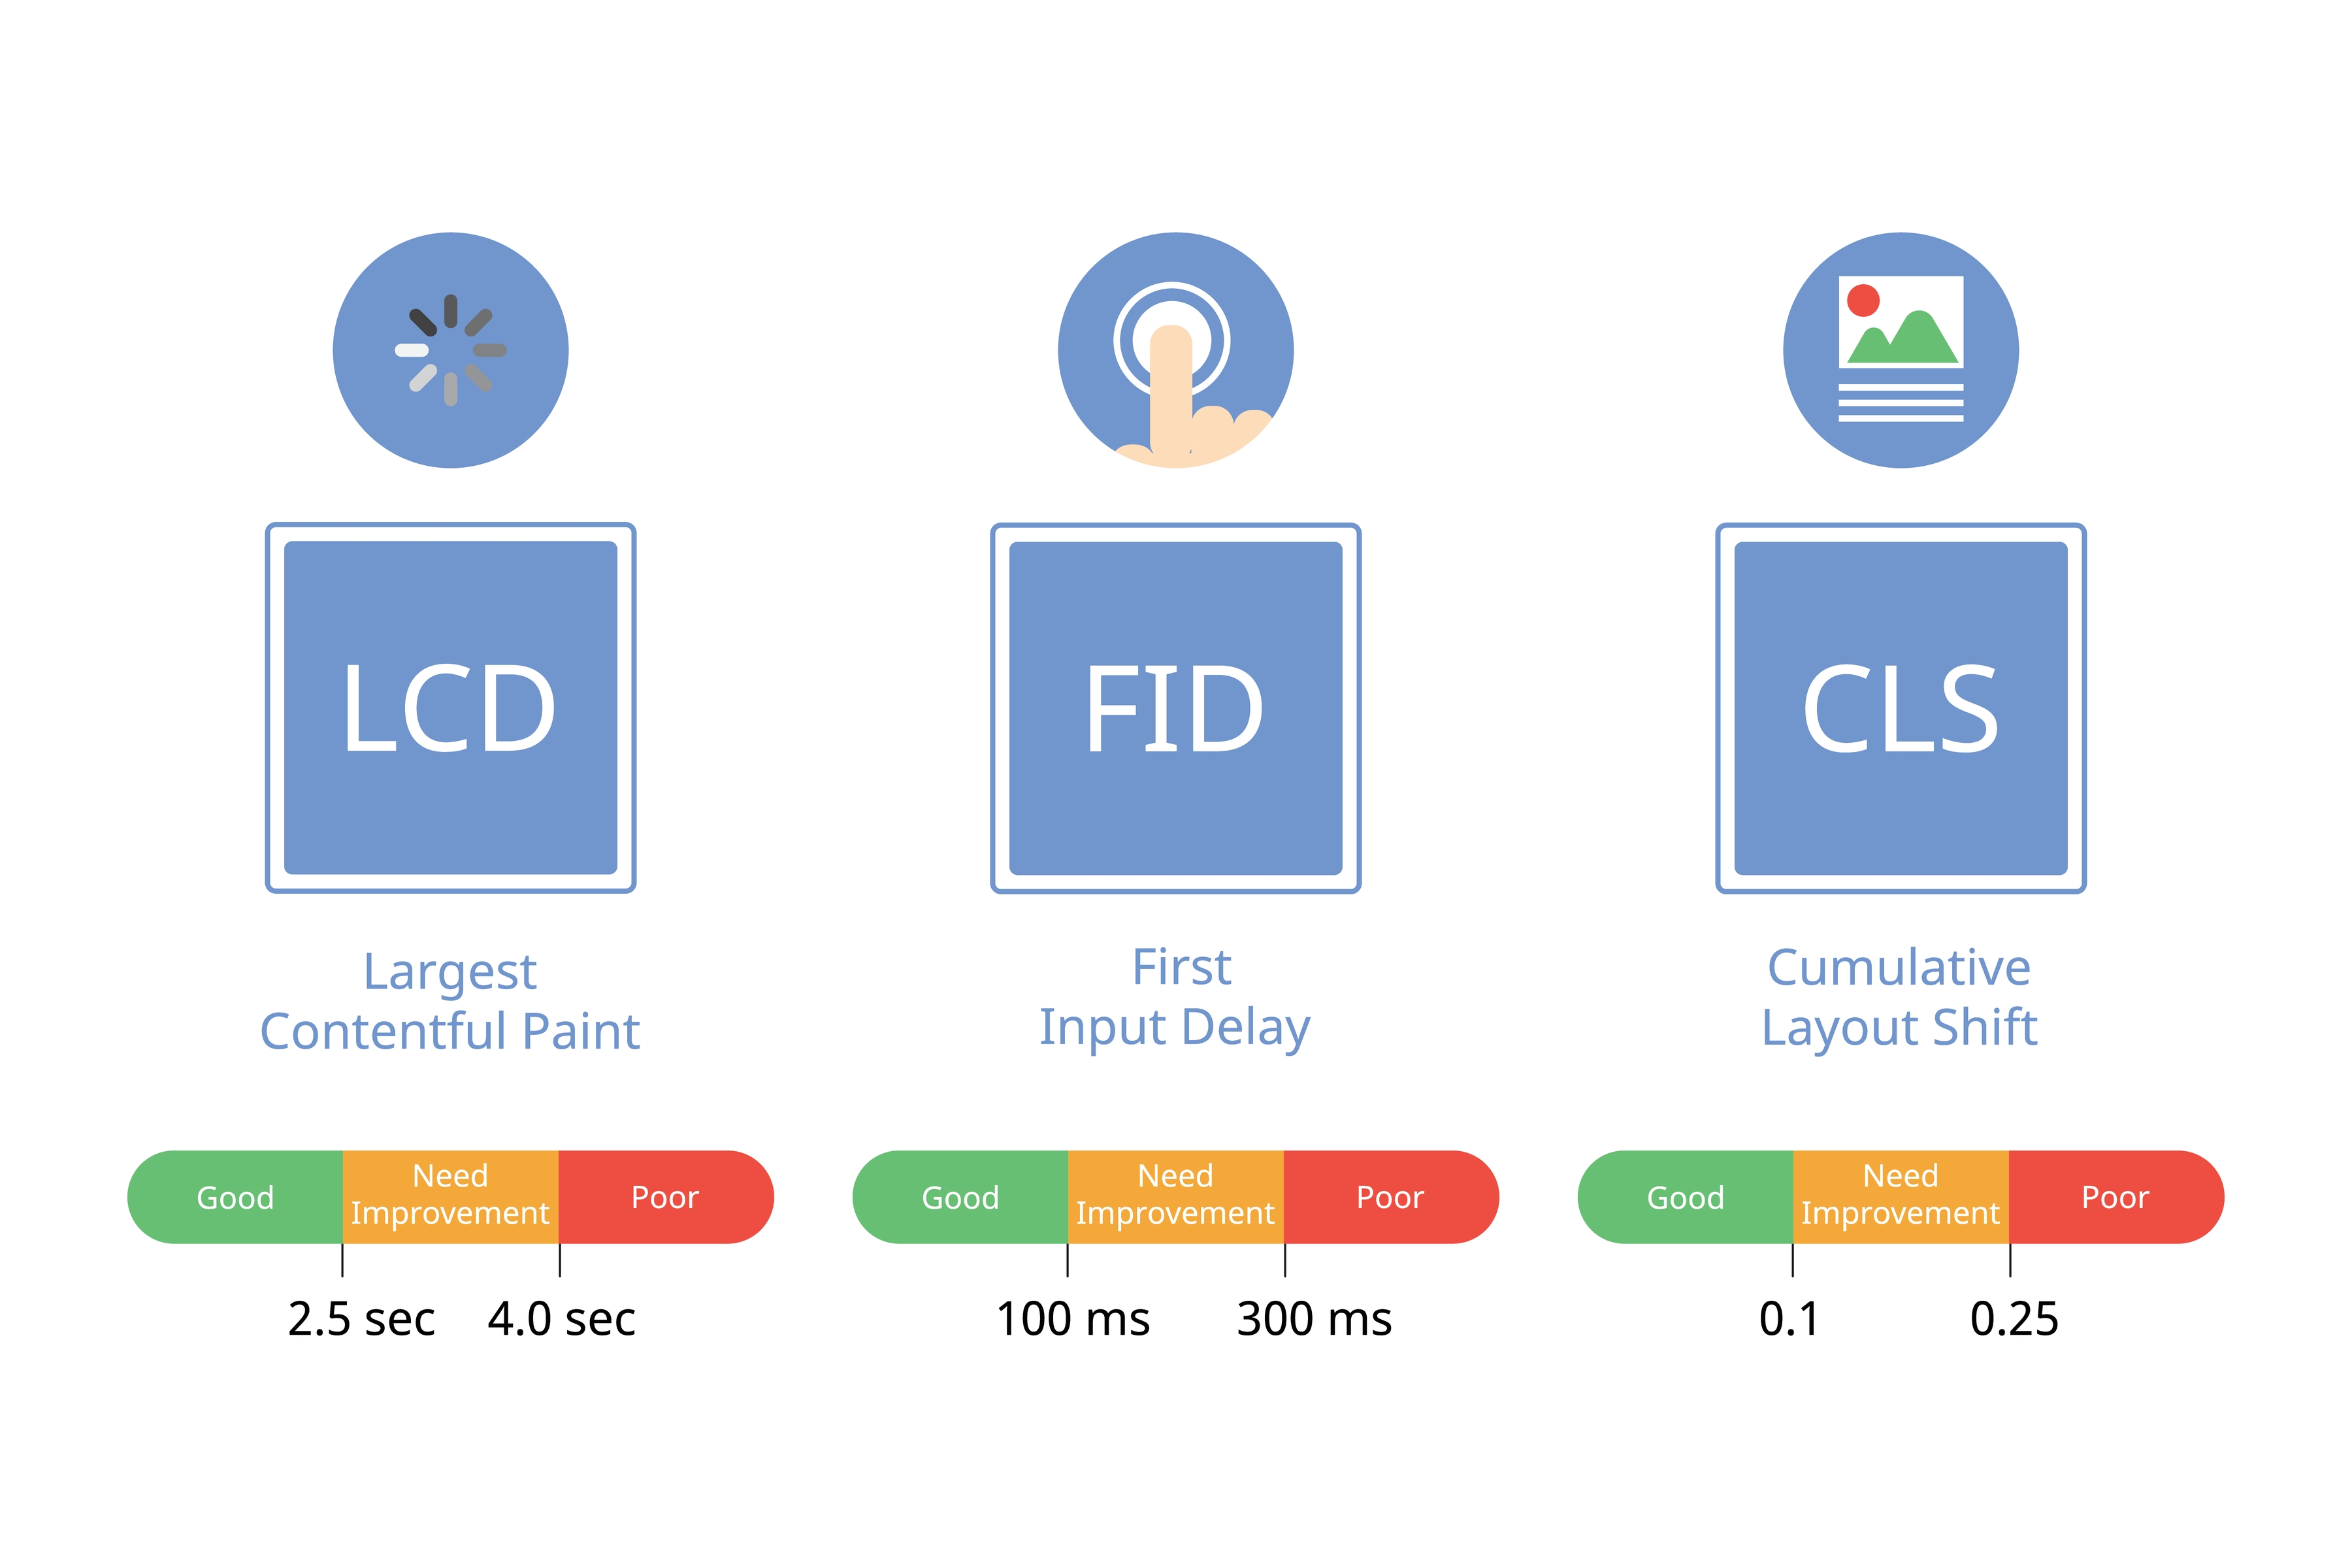
As Google announced some time ago, page experience will be a ranking factor for 2021. As a top-of-the-line site builds its way to the top of the search engine results, user experience has always been of utmost importance, but now, it will play an even larger role in helping make awesome sites for your visitors. The metrics are driven by the Web Core Vitals, which are at the core of the Web. Introducing LCP, FID, and CLS!
Our team has spoken before about this page experience update, but we’d like to revisit those Web Core Vitals. The site speed metric is a tricky one. Additionally, it varies when you test it. Results aren’t always consistent. Some metrics simply have to turn green and that’s all you need to do.
There are numerous metrics to consider, but Google has identified just three so-called Web Core Vitals. These are Google’s priorities for the year ahead. As they evaluate these metrics over a longer period, Google may adjust or add to these metrics every year.

The three pillars of page experience: –
- Largest Contentful Paint: This refers to the length of time it takes for the largest piece of content to appear on the screen. This could either be text or an image. Sites that score well are perceived as loading fast. A slow site can lead to frustration.
- In the field of First Input Delay, the speed at which a site reacts to the first input is measured. An example might be a tap on a button. The user gets the sense from a high grade here that a site is responsive and quick to respond to input. The opposite, again, is frustrating.
- Visual stability is measured by CLS (Cumulative Layout Shift), which is a measure of the site’s visual stability. Specifically, do things move around on the screen while it is loading – and how often does that happen? When an ad is slow to load, clicking on a button is extremely frustrating.
Google’s director of web quality, said that if you want your site to rank higher, all three metrics must be green. It is true that you should not optimize your site to get green scores – however, you will benefit your visitors if your site has green scores. Content is essential to attracting and keeping visitors – but so is happy content!
Different tools use different metrics
Web Vitals are collected from various sources for every page experience tool. All tools are different in their purpose, so their metrics will vary as well. Google’s tool for improving the page experience is the Web Core Vitals, as these are used across all of its tools.
The numbers look intimidating, but what do they mean? How do you interpret them? Are you really fast enough? How soon will I be able to get a good grade? These metrics are filled with questions. Despite Google’s best efforts, this continues to be a complex topic. It can be challenging to determine what factors affect site speed and user experience.
What you need to know
You can start optimizing for the LCP now that you know what it is. If you want your LCP to occur in the first 2.5 seconds of the page loading, you should aim for that. You can consider anything below 4 seconds to be under-performing, and everything above that to be over-performing.
Other Performance Metrics
Developers can utilize Web Core Vitals to improve their website experience, as we discussed. Developers also need to understand how their code impacts the way their site’s users consume content in addition to the metrics mentioned above.
We can use these metrics to understand how visitors experience your web page even though they are not considered part of user experience metrics. Let’s take a closer look at a few other metrics you can use to understand how visitors experience your web page.
Speed Index
The Speed Index (SI) measures the average display time of content on your website to show to users. Faster websites offer better online experiences. Measured in milliseconds, this metric identifies excessive JavaScript on a page and includes a range of SI scores:
- Green (fast): 0–4.3seconds
- Orange (moderate): 4.4–5.8 seconds
- Red (slow) : 5.8+ seconds
Time to Interactive
When TTI (Time to Interactive) occurs, a page becomes fully interactive after all the content has been loaded. The JavaScript tag identifies unnecessary JavaScript in pages that are measured in seconds and are scored as follows:
- Green (fast) : 0–3.8 seconds
- Orange (moderate) : 3.9–7.3 seconds
- Red (slow) : 7.3 + seconds
Total Blocking Time
Counting the number of milliseconds it takes for a web page to respond to specific user input is called the Total Blocking Time. This metric identifies pages with excessive JavaScript, and this value is measured in milliseconds:
- Green (fast) : 0–300 ms
- Orange (moderate) : 300–600 ms
- Red (slow) : 600+ ms
Page Performance Scores
This score is derived from the aggregated scores for all mobile and desktop visits and includes all the metrics that impact user experience. In order to quickly understand pages that require further investigation, the weighted average is used.
Developers can refer to all of these metrics as part of the Page Performance Score metric by referencing the specific score of 90 (good), 50-90 (in need of improvement), and below 50 (poor).

Started working as a digital marketing expert, Varun Sharma is now also a well-known digital marketing speaker – a speaker on performance development, and a trusted mentor to businesses in the digital world. His keynote expositions are based on the digital marketing theories, which provide a fascinating insight into the secrets of high performance.

